Relational Database & UI Demo
A platform that consolidates engagement data stored across multiple spreadsheets into a relational database and simple user interface (UI), making it easier to view, filter, and update data.
Interface Previews
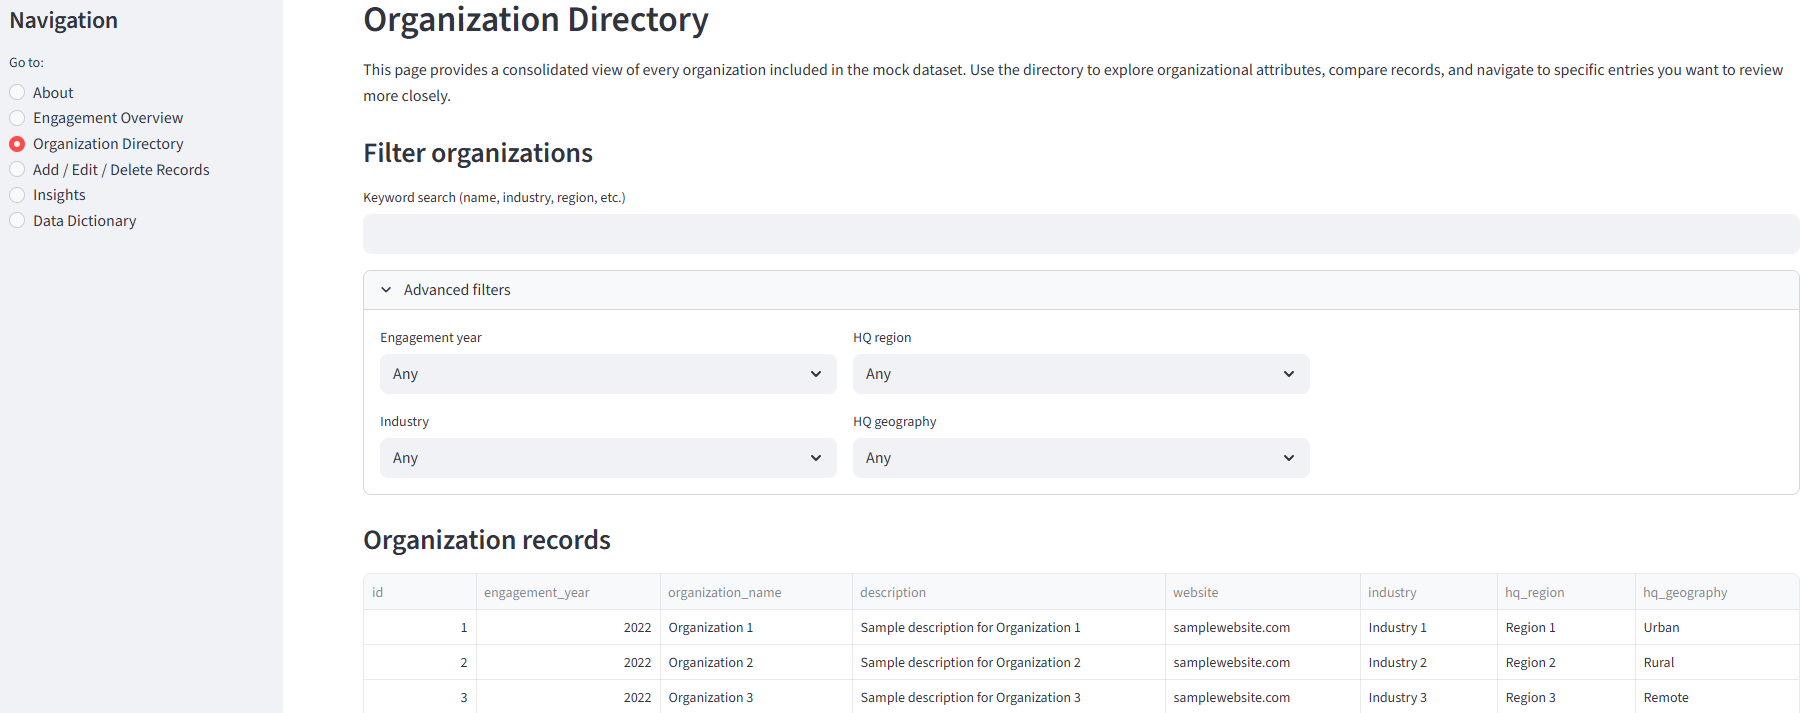
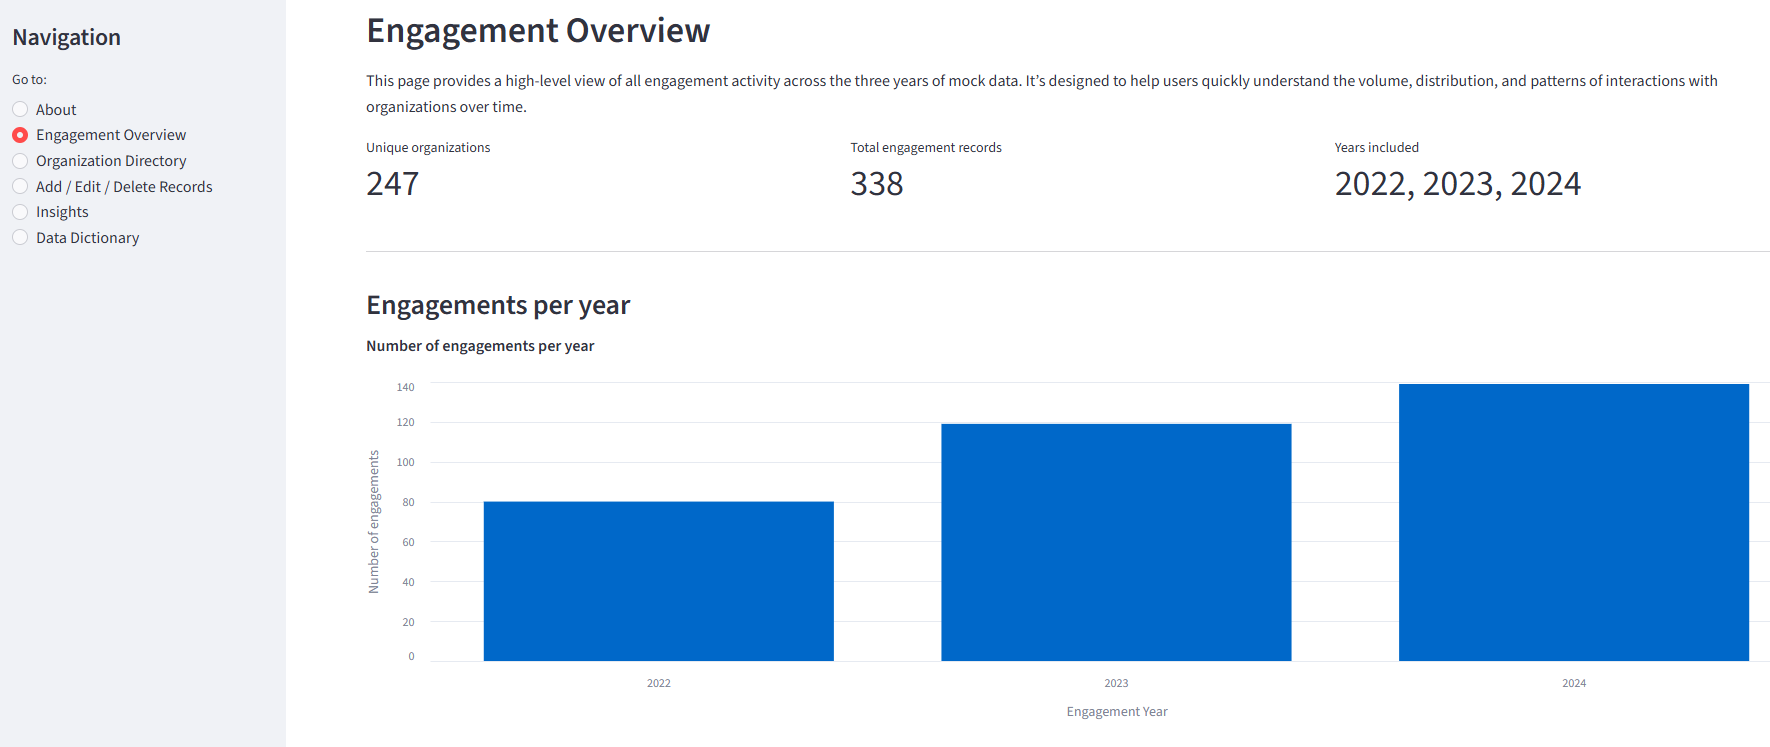
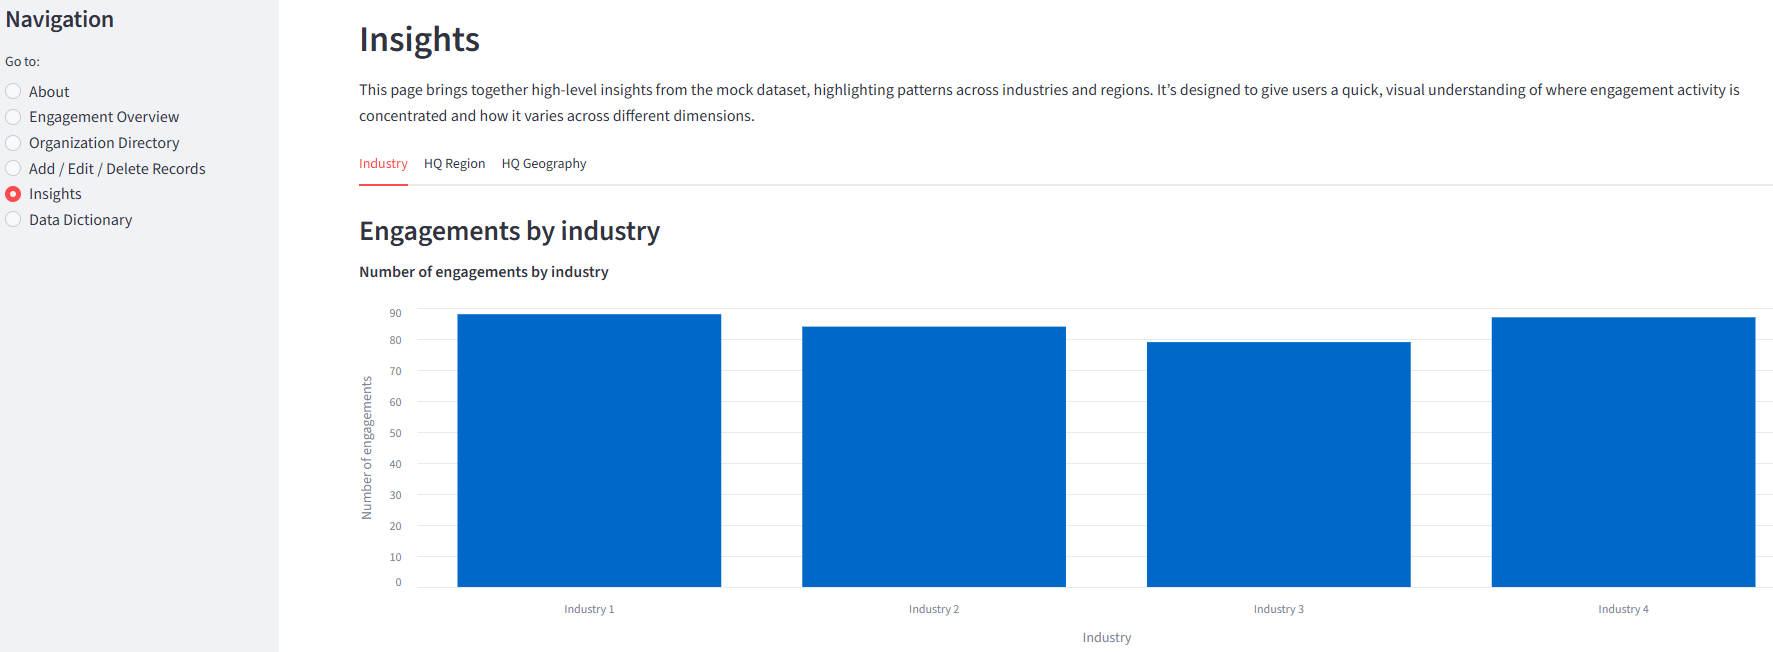
These previews show how the platform displays, filters, and organizes engagement data across multiple years.
Directory View
Overview Dashboard
Insights
Approach
Turn multiple spreadsheets into an interactive platform that non‑technical teams can use to manage data.
Step 1
Data Cleaning
Standardize terms, fields, and formats so the data can be merged reliably.
Step 2
Relational Database
Load the Excel files into a relational database so they can be analyzed together and maintained as a single source of truth.
Step 3
Interactive Platform
Build a clear UI so non‑technical teams can view, filter, update, and visualize data without touching the source files.
Tech Stack
This project uses Python, SQL, SQLite, and Streamlit. Python and SQL are languages that can scale with enterprise databases, while SQLite and Streamlit are lightweight tools that may not always support large‑scale applications. Nevertheless, the underlying techniques and workflows align with those used in production.
Results
The result is a platform that replaces fragmented spreadsheets with a maintainable relational architecture.
Unified Records
A Single Source of Truth
Users can browse all engagement records across 2022 to 2024 in a single, consistent view.
Structured Interactions
Validated Data Entry
Records can be added, edited, and deleted through validated forms, reducing errors common in spreadsheet workflows.
Actionable Insights
Patterns and Trends
Charts and filters make it easier to identify patterns by industry, region, and organization.
Scaling the Architecture
This project uses lightweight, free tools appropriate for a personal portfolio. In organizational settings, teams often select tools that support privacy, compliance, access controls, and higher data volumes. The examples below illustrate common low‑code and technical alternatives.
These examples are provided for context and are not endorsements.
Data Processing
Low Code: Manual cleaning in Excel or Google Sheets
Technical: Python with Pandas, dbt Core, Apache Spark
Data Storage
Low Code: Airtable, SharePoint Lists, Google Sheets
Technical: PostgreSQL, MySQL, Snowflake
Data Linking
Low Code: Airtable Automate, Power Automate, AppSheet
Technical: Apache Airflow, Prefect, AWS Lambda
UI Development
Low Code: Airtable Interfaces, Power Apps, AppSheet
Technical: React, Django, Flask